| visible | from | isS4 | |
|---|---|---|---|
as.ppp.data.frame |
TRUE | spatstat.geom | FALSE |
as.ppp.default |
TRUE | spatstat.geom | FALSE |
as.ppp.influence.ppm |
TRUE | spatstat.model | FALSE |
as.ppp.lpp |
TRUE | spatstat.linnet | FALSE |
as.ppp.matrix |
TRUE | spatstat.geom | FALSE |
as.ppp.NAobject |
TRUE | spatstat.geom | FALSE |
as.ppp.ppp |
TRUE | spatstat.geom | FALSE |
as.ppp.psp |
TRUE | spatstat.geom | FALSE |
as.ppp.quad |
TRUE | spatstat.geom | FALSE |
as.ppp.ssf |
TRUE | spatstat.explore | FALSE |
36 ppp
ImportantDisclaimer
These packages (Note 1) are a one-person project undergoing rapid evolution. Backward compatibility (per Hadley Wickham) is provided as a courtesy rather than a guarantee.
Until further notice, these packages should
- not be used as a basis for research grant applications,
- not be cited as an actively maintained tool in a peer-reviewed manuscript,
- not be used to support or fulfill requirements for pursuing an academic degree.
In addition, work primarily based on these packages (Note 1) should not be presented at academic conferences or similar scholarly venues.
Furthermore, a person’s ability to use these packages (Note 1) does not necessarily imply an understanding of their underlying mechanisms. Accordingly, demonstration of their use alone should not be considered sufficient evidence of expertise, nor should it be credited as a basis for academic promotion or advancement.
These statements do not apply to the contributors (Tip 1) to these packages (Note 1) with respect to their specific contributions.
These statements do not apply when the maintainer of these packages (Note 1), Tingting Zhan, is credited as the first author, the lead author, and/or the corresponding author in a peer-reviewed manuscript, or as the Principal Investigator or Co-Principal Investigator in a research grant application and/or a final research progress report.
These statements are advisory in nature and do not modify or restrict the rights granted under the GNU General Public License https://www.r-project.org/Licenses/.
The function ppp() (v3.7.3, GPL (>= 2)) creates a two-dimensional point-pattern object (ppp.object), i.e., an R object of S3 class 'ppp'. A point-pattern contains the \(x\)- and \(y\)-coordinates in an observation window (owin, Chapter 34) and may contain
- no marks, e.g.,
vesicles(Section 10.24), etc.; - a numeric mark, e.g.,
longleaf(Section 10.17), etc.; - a multi-type mark, e.g.,
ants(Section 10.2), etc.; - more than one numeric and/or multi-type marks, e.g.,
betacells(Section 10.4),nbfires(Section 10.19), etc.
The S3 generic function as.ppp() (v3.7.3, GPL (>= 2)) converts R objects of various classes into a point-pattern. Note 36.1 and Note 36.2 summarize the S3 methods for the generic function as.ppp() and the S3 methods for the class 'ppp', respectively, in the spatstat.* family of packages,
| visible | from | generic | isS4 | |
|---|---|---|---|---|
[.ppp |
TRUE | spatstat.geom | base::[ |
FALSE |
[<-.ppp |
TRUE | spatstat.geom | base::`[<-` |
FALSE |
affine.ppp |
TRUE | spatstat.geom | spatstat.geom::affine |
FALSE |
anyDuplicated.ppp |
TRUE | spatstat.geom | base::anyDuplicated |
FALSE |
as.data.frame.ppp |
TRUE | spatstat.geom | base::as.data.frame |
FALSE |
as.im.ppp |
TRUE | spatstat.geom | spatstat.geom::as.im |
FALSE |
as.layered.ppp |
TRUE | spatstat.geom | spatstat.geom::as.layered |
FALSE |
as.owin.ppp |
TRUE | spatstat.geom | spatstat.geom::as.owin |
FALSE |
as.ppp.ppp |
TRUE | spatstat.geom | spatstat.geom::as.ppp |
FALSE |
auc.ppp |
TRUE | spatstat.explore | spatstat.explore::auc |
FALSE |
berman.test.ppp |
TRUE | spatstat.explore | spatstat.explore::berman.test |
FALSE |
boundingbox.ppp |
TRUE | spatstat.geom | spatstat.geom::boundingbox |
FALSE |
boundingcentre.ppp |
TRUE | spatstat.geom | spatstat.geom::boundingcentre |
FALSE |
boundingcircle.ppp |
TRUE | spatstat.geom | spatstat.geom::boundingcircle |
FALSE |
boundingradius.ppp |
TRUE | spatstat.geom | spatstat.geom::boundingradius |
FALSE |
bw.abram.ppp |
TRUE | spatstat.explore | spatstat.univar::bw.abram |
FALSE |
bw.relrisk.ppp |
TRUE | spatstat.explore | spatstat.explore::bw.relrisk |
FALSE |
by.ppp |
TRUE | spatstat.geom | base::by |
FALSE |
cdf.test.ppp |
TRUE | spatstat.explore | spatstat.explore::cdf.test |
FALSE |
circumradius.ppp |
TRUE | spatstat.geom | spatstat.geom::circumradius |
FALSE |
closepairs.ppp |
TRUE | spatstat.geom | spatstat.geom::closepairs |
FALSE |
closing.ppp |
TRUE | spatstat.geom | spatstat.geom::closing |
FALSE |
connected.ppp |
TRUE | spatstat.geom | spatstat.geom::connected |
FALSE |
coords.ppp |
TRUE | spatstat.geom | spatstat.geom::coords |
FALSE |
coords<-.ppp |
TRUE | spatstat.geom | spatstat.geom::`coords<-` |
FALSE |
coxmap.ppp |
TRUE | spatstat.explore | spatstat.explore::coxmap |
FALSE |
crossdist.ppp |
TRUE | spatstat.geom | spatstat.geom::crossdist |
FALSE |
crosspairs.ppp |
TRUE | spatstat.geom | spatstat.geom::crosspairs |
FALSE |
cut.ppp |
TRUE | spatstat.geom | base::cut |
FALSE |
default.symbolmap.ppp |
TRUE | spatstat.geom | spatstat.geom::default.symbolmap |
FALSE |
density.ppp |
TRUE | spatstat.explore | stats::density |
FALSE |
densityAdaptiveKernel.ppp |
TRUE | spatstat.explore | spatstat.univar::densityAdaptiveKernel |
FALSE |
densityfun.ppp |
TRUE | spatstat.explore | spatstat.explore::densityfun |
FALSE |
densityHeat.ppp |
TRUE | spatstat.explore | spatstat.explore::densityHeat |
FALSE |
densityVoronoi.ppp |
TRUE | spatstat.explore | spatstat.explore::densityVoronoi |
FALSE |
dilation.ppp |
TRUE | spatstat.geom | spatstat.geom::dilation |
FALSE |
distfun.ppp |
TRUE | spatstat.geom | spatstat.geom::distfun |
FALSE |
distmap.ppp |
TRUE | spatstat.geom | spatstat.geom::distmap |
FALSE |
domain.ppp |
TRUE | spatstat.geom | spatstat.geom::domain |
FALSE |
duplicated.ppp |
TRUE | spatstat.geom | base::duplicated |
FALSE |
edit.ppp |
TRUE | spatstat.geom | utils::edit |
FALSE |
envelope.ppp |
TRUE | spatstat.explore | spatstat.explore::envelope |
FALSE |
erosion.ppp |
TRUE | spatstat.geom | spatstat.geom::erosion |
FALSE |
fardist.ppp |
TRUE | spatstat.geom | spatstat.geom::fardist |
FALSE |
flipxy.ppp |
TRUE | spatstat.geom | spatstat.geom::flipxy |
FALSE |
Frame<-.ppp |
TRUE | spatstat.geom | spatstat.geom::`Frame<-` |
FALSE |
has.close.ppp |
TRUE | spatstat.geom | spatstat.geom::has.close |
FALSE |
head.ppp |
TRUE | spatstat.geom | utils::head |
FALSE |
identify.ppp |
TRUE | spatstat.geom | graphics::identify |
FALSE |
intensity.ppp |
TRUE | spatstat.geom | spatstat.geom::intensity |
FALSE |
is.connected.ppp |
TRUE | spatstat.geom | spatstat.geom::is.connected |
FALSE |
is.empty.ppp |
TRUE | spatstat.geom | spatstat.geom::is.empty |
FALSE |
is.marked.ppp |
TRUE | spatstat.geom | spatstat.geom::is.marked |
FALSE |
is.multitype.ppp |
TRUE | spatstat.geom | spatstat.geom::is.multitype |
FALSE |
kppm.ppp |
TRUE | spatstat.model | spatstat.model::kppm |
FALSE |
lurking.ppp |
TRUE | spatstat.model | spatstat.model::lurking |
FALSE |
make.simulrecipe.ppp |
TRUE | spatstat.explore | spatstat.explore::make.simulrecipe |
FALSE |
markformat.ppp |
TRUE | spatstat.geom | spatstat.geom::markformat |
FALSE |
marks.ppp |
TRUE | spatstat.geom | spatstat.geom::marks |
FALSE |
marks<-.ppp |
TRUE | spatstat.geom | spatstat.geom::`marks<-` |
FALSE |
multiplicity.ppp |
TRUE | spatstat.geom | spatstat.geom::multiplicity |
FALSE |
nnclean.ppp |
TRUE | spatstat.explore | spatstat.explore::nnclean |
FALSE |
nncross.ppp |
TRUE | spatstat.geom | spatstat.geom::nncross |
FALSE |
nndensity.ppp |
TRUE | spatstat.explore | spatstat.explore::nndensity |
FALSE |
nndist.ppp |
TRUE | spatstat.geom | spatstat.geom::nndist |
FALSE |
nnfun.ppp |
TRUE | spatstat.geom | spatstat.geom::nnfun |
FALSE |
nnwhich.ppp |
TRUE | spatstat.geom | spatstat.geom::nnwhich |
FALSE |
nobjects.ppp |
TRUE | spatstat.geom | spatstat.geom::nobjects |
FALSE |
npoints.ppp |
TRUE | spatstat.geom | spatstat.geom::npoints |
FALSE |
opening.ppp |
TRUE | spatstat.geom | spatstat.geom::opening |
FALSE |
pairdist.ppp |
TRUE | spatstat.geom | spatstat.geom::pairdist |
FALSE |
pcf.ppp |
TRUE | spatstat.explore | spatstat.explore::pcf |
FALSE |
periodify.ppp |
TRUE | spatstat.geom | spatstat.geom::periodify |
FALSE |
persp.ppp |
TRUE | spatstat.geom | graphics::persp |
FALSE |
pixellate.ppp |
TRUE | spatstat.geom | spatstat.geom::pixellate |
FALSE |
plot.ppp |
TRUE | spatstat.geom | base::plot |
FALSE |
ppm.ppp |
TRUE | spatstat.model | spatstat.model::ppm |
FALSE |
print.ppp |
TRUE | spatstat.geom | base::print |
FALSE |
quadrat.test.ppp |
TRUE | spatstat.explore | spatstat.explore::quadrat.test |
FALSE |
quadratcount.ppp |
TRUE | spatstat.geom | spatstat.geom::quadratcount |
FALSE |
quantess.ppp |
TRUE | spatstat.geom | spatstat.geom::quantess |
FALSE |
rebound.ppp |
TRUE | spatstat.geom | spatstat.geom::rebound |
FALSE |
relevel.ppp |
TRUE | spatstat.geom | stats::relevel |
FALSE |
relrisk.ppp |
TRUE | spatstat.explore | spatstat.explore::relrisk |
FALSE |
relriskHeat.ppp |
TRUE | spatstat.explore | spatstat.explore::relriskHeat |
FALSE |
rescale.ppp |
TRUE | spatstat.geom | spatstat.geom::rescale |
FALSE |
resolve.lambda.ppp |
TRUE | spatstat.explore | spatstat.explore::resolve.lambda |
FALSE |
resolve.lambdacross.ppp |
TRUE | spatstat.explore | spatstat.explore::resolve.lambdacross |
FALSE |
resolve.reciplambda.ppp |
TRUE | spatstat.explore | spatstat.explore::resolve.reciplambda |
FALSE |
rexplode.ppp |
TRUE | spatstat.geom | spatstat.geom::rexplode |
FALSE |
rhohat.ppp |
TRUE | spatstat.explore | spatstat.explore::rhohat |
FALSE |
rjitter.ppp |
TRUE | spatstat.geom | spatstat.geom::rjitter |
FALSE |
roc.ppp |
TRUE | spatstat.explore | spatstat.explore::roc |
FALSE |
rotate.ppp |
TRUE | spatstat.geom | spatstat.geom::rotate |
FALSE |
round.ppp |
TRUE | spatstat.geom | base::round |
FALSE |
rounding.ppp |
TRUE | spatstat.geom | spatstat.univar::rounding |
FALSE |
rshift.ppp |
TRUE | spatstat.random | spatstat.random::rshift |
FALSE |
scalardilate.ppp |
TRUE | spatstat.geom | spatstat.geom::scalardilate |
FALSE |
scanmeasure.ppp |
TRUE | spatstat.explore | spatstat.explore::scanmeasure |
FALSE |
sdr.ppp |
TRUE | spatstat.explore | spatstat.explore::sdr |
FALSE |
segregation.test.ppp |
TRUE | spatstat.explore | spatstat.explore::segregation.test |
FALSE |
sharpen.ppp |
TRUE | spatstat.explore | spatstat.explore::sharpen |
FALSE |
shift.ppp |
TRUE | spatstat.geom | spatstat.geom::shift |
FALSE |
Smooth.ppp |
TRUE | spatstat.explore | spatstat.explore::Smooth |
FALSE |
Smoothfun.ppp |
TRUE | spatstat.explore | spatstat.explore::Smoothfun |
FALSE |
SmoothHeat.ppp |
TRUE | spatstat.explore | spatstat.explore::SmoothHeat |
FALSE |
spatialCovariateEvidence.ppp |
TRUE | spatstat.explore | spatstat.explore::spatialCovariateEvidence |
FALSE |
SpatialMedian.ppp |
TRUE | spatstat.explore | spatstat.explore::SpatialMedian |
FALSE |
SpatialQuantile.ppp |
TRUE | spatstat.explore | spatstat.explore::SpatialQuantile |
FALSE |
split.ppp |
TRUE | spatstat.geom | base::split |
FALSE |
split<-.ppp |
TRUE | spatstat.geom | base::`split<-` |
FALSE |
subset.ppp |
TRUE | spatstat.geom | base::subset |
FALSE |
summary.ppp |
TRUE | spatstat.geom | base::summary |
FALSE |
superimpose.ppp |
TRUE | spatstat.geom | spatstat.geom::superimpose |
FALSE |
tail.ppp |
TRUE | spatstat.geom | utils::tail |
FALSE |
text.ppp |
TRUE | spatstat.geom | graphics::text |
FALSE |
unique.ppp |
TRUE | spatstat.geom | base::unique |
FALSE |
uniquemap.ppp |
TRUE | spatstat.geom | spatstat.univar::uniquemap |
FALSE |
unitname.ppp |
TRUE | spatstat.geom | spatstat.geom::unitname |
FALSE |
unitname<-.ppp |
TRUE | spatstat.geom | spatstat.geom::`unitname<-` |
FALSE |
unmark.ppp |
TRUE | spatstat.geom | spatstat.geom::unmark |
FALSE |
unstack.ppp |
TRUE | spatstat.geom | utils::unstack |
FALSE |
Window.ppp |
TRUE | spatstat.geom | spatstat.geom::Window |
FALSE |
Window<-.ppp |
TRUE | spatstat.geom | spatstat.geom::`Window<-` |
FALSE |
Table 36.1 summarizes the S3 methods for the class 'ppp' in package groupedHyperframe (v0.4.0, GPL-2),
S3 methods groupedHyperframe::*.ppp (v0.4.0)
| visible | generic | isS4 | |
|---|---|---|---|
.rmax.ppp |
FALSE | groupedHyperframe::.rmax |
FALSE |
aggregate_marks.ppp |
FALSE | groupedHyperframe::aggregate_marks |
FALSE |
append_marks<-.ppp |
FALSE | groupedHyperframe::`append_marks<-` |
FALSE |
density_marks.ppp |
FALSE | groupedHyperframe::density_marks |
FALSE |
Emark_.ppp |
FALSE | groupedHyperframe::Emark_ |
FALSE |
Gcross_.ppp |
FALSE | groupedHyperframe::Gcross_ |
FALSE |
is.numeric.ppp |
FALSE | base::is.numeric |
FALSE |
Jcross_.ppp |
FALSE | groupedHyperframe::Jcross_ |
FALSE |
Kcross_.ppp |
FALSE | groupedHyperframe::Kcross_ |
FALSE |
kerndens.ppp |
FALSE | groupedHyperframe::kerndens |
FALSE |
Kmark_.ppp |
FALSE | groupedHyperframe::Kmark_ |
FALSE |
Lcross_.ppp |
FALSE | groupedHyperframe::Lcross_ |
FALSE |
markconnect_.ppp |
FALSE | groupedHyperframe::markconnect_ |
FALSE |
markcorr_.ppp |
FALSE | groupedHyperframe::markcorr_ |
FALSE |
markvario_.ppp |
FALSE | groupedHyperframe::markvario_ |
FALSE |
Math.ppp |
FALSE | methods::Math |
FALSE |
na.exclude.ppp |
FALSE | stats::na.exclude |
FALSE |
na.omit.ppp |
FALSE | stats::na.omit |
FALSE |
nncross_.ppp |
FALSE | groupedHyperframe::nncross_ |
FALSE |
pairwise_cor_spatial.ppp |
FALSE | groupedHyperframe::pairwise_cor_spatial |
FALSE |
quantile.ppp |
FALSE | stats::quantile |
FALSE |
rlabelRes.ppp |
FALSE | groupedHyperframe::rlabelRes |
FALSE |
Summary.ppp |
FALSE | methods::Summary |
FALSE |
Vmark_.ppp |
FALSE | groupedHyperframe::Vmark_ |
FALSE |
36.1 Missing Marks Handling
The S3 methods na.omit.ppp() and na.exclude.ppp() omits and excludes, respectively, the missing marks from a point-pattern. Both functions return a point-pattern.
If missingness exists in the marks, the 'na.action'-attribute of the marks is saved as an attribute of the returned point-pattern.
na.omit.ppp() and na.exclude.ppp() on 'none' mark-format
spatstat.data::vesicles |>
  na.omit() |>
  identical(y = spatstat.data::vesicles) |>
  stopifnot()
spatstat.data::vesicles |>
  na.exclude()|>
  identical(y = spatstat.data::vesicles) |>
stopifnot()na.omit.ppp() and na.exclude.ppp() on 'vector' mark-format, no missingness
spatstat.data::ants |>
  na.omit() |>
  identical(y = spatstat.data::ants) |>
  stopifnot()
spatstat.data::ants |>
  na.exclude() |>
  identical(y = spatstat.data::ants) |>
stopifnot()na.omit.ppp() and na.exclude.ppp() on 'dataframe' mark-format
nbfires_omit = spatstat.data::nbfires |>
  na.omit()
nbfires_exclude = spatstat.data::nbfires |>
na.exclude()list(
nbfires = spatstat.data::nbfires,
omit = nbfires_omit,
exclude = nbfires_exclude
) |>
vapply(FUN = spatstat.geom::npoints.ppp, FUN.VALUE = NA_integer_)
# nbfires omit exclude
# 7108 6989 6989list(
omit = nbfires_omit,
exclude = nbfires_exclude
) |>
vapply(FUN = \(i) {
i |>
attr(which = 'na.action', exact = TRUE) |>
attr(which = 'class', exact = TRUE)
}, FUN.VALUE = NA_character_)
# omit exclude
# "omit" "exclude"Note that the function ppp() (v3.7.3, GPL (>= 2)) already removes missing \(x\)- and \(y\)-coords in the creation of a point-pattern.
Note that the S3 method plot.ppp() (v3.7.3, GPL (>= 2)) also removes missing marks (email with Dr. Baddeley, 2025-01-07).
36.2 Are Marks Numeric?
The S3 method is.numeric.ppp() determines whether each of the marks, if any, in a point-pattern are numeric.
is.numeric.ppp() on 'none' mark-format
spatstat.data::vesicles |>
  is.numeric()
# logical(0)is.numeric.ppp() on numeric mark
spatstat.data::longleaf |>
  is.numeric()
# [1] TRUEis.numeric.ppp() on multi-type mark
spatstat.data::ants |>
  is.numeric()
# [1] FALSE
The S3 methods is.numeric.ppp() and is.multitype.ppp() (v3.7.3, GPL (>= 2)) behave differently for a point-pattern with 'dataframe' mark-format, e.g., betacells (Section 10.4).
is.multitype.ppp() on 'dataframe' mark-format
spatstat.data::betacells |>
  spatstat.geom::is.multitype.ppp()
# [1] FALSEis.numeric.ppp() on 'dataframe' mark-format
spatstat.data::betacells |>
  is.numeric()
#  type  area
# FALSE  TRUE
36.3 Group-Generic of Numeric Mark(s)
36.3.1 Math
Package groupedHyperframe (v0.4.0, GPL-2) implements the following S3 methods (Table 36.2) of the Math-groupGeneric,
S3 methods of methods::Math (v4.5.3)
| visible | isS4 | |
|---|---|---|
Math.ppp |
FALSE | FALSE |
Math.psp |
FALSE | FALSE |
Math.quosure |
FALSE | FALSE |
Math.ratetable |
FALSE | FALSE |
Math.sparse3Darray |
FALSE | FALSE |
Math.Surv |
FALSE | FALSE |
Math.Surv2 |
FALSE | FALSE |
Math.tess |
FALSE | FALSE |
Math.UUID |
FALSE | FALSE |
Math.vctrs_sclr |
FALSE | FALSE |
Math.vctrs_vctr |
FALSE | FALSE |
The S3 method Math.ppp() transforms one or more numeric marks of a point-pattern, and returns a point-pattern with the transformed marks. The \(x\)- and \(y\)-coordinates and the multi-type marks of the input point-pattern remain unchanged. This function, as well as the S3 method Math.tess() (Section 42.1.1), serves a similar purpose (Table 36.3) to the S3 methods Math.fv() (v3.8.0, GPL (>= 2)) and Math.im() (v3.7.3, GPL (>= 2)).
Math Group-Generic
Math.ppp() |
Math.tess() |
Math.fv() |
Math.im() |
|
|---|---|---|---|---|
| Input & Output | ppp.object (Chapter 36) |
tessellation (Chapter 42) |
fv.object (Chapter 20) |
im.object (Chapter 28) |
| Operates On | numeric mark(s) | numeric mark(s) | function-values (Listing 20.6) | “grey value” at each pixel |
| Does Not Alter | multi-type marks (if any), \(x\)- and \(y\)-coordinates, observation window, etc. | observation window, tiles, etc. | function argument (Listing 20.6), etc. | \(x\)- and \(y\)-coordinates, dimension, etc. |
Listing 36.9 applies the log-transformations on the point-pattern bronzefilter (Section 10.5) with 'vector' mark-format.
log-transformations on 'vector' mark-format
list(
  original = spatstat.data::bronzefilter,
  log = spatstat.data::bronzefilter |> log(),
  log1p = spatstat.data::bronzefilter |> log1p()
) |>
  lapply(FUN = spatstat.geom::summary.ppp) |>
  lapply(FUN = getElement, name = 'marks')
# $original
#    Min. 1st Qu.  Median    Mean 3rd Qu.    Max.
#   0.013   0.120   0.160   0.167   0.200   0.467
#
# $log
#    Min. 1st Qu.  Median    Mean 3rd Qu.    Max.
# -4.3428 -2.1203 -1.8326 -1.8989 -1.6094 -0.7614
#
# $log1p
#    Min. 1st Qu.  Median    Mean 3rd Qu.    Max.
# 0.01292 0.11333 0.14842 0.15244 0.18232 0.38322
Listing 36.10 applies the log-transformation on the numeric marks in the point-pattern betacells (Section 10.4) with 'dataframe' mark-format.
log-transformations on numeric marks in 'dataframe' mark-format
list(
  original = spatstat.data::betacells,
  log = spatstat.data::betacells |> log()
) |>
  lapply(FUN = spatstat.geom::summary.ppp) |>
  lapply(FUN = getElement, name = 'marks')
# $original
#   type         area
#  off:70   Min.   :168.3
#  on :65   1st Qu.:248.8
#           Median :279.4
#           Mean   :291.2
#           3rd Qu.:324.2
#           Max.   :514.4
#
# $log
#   type         area
#  off:70   Min.   :5.126
#  on :65   1st Qu.:5.517
#           Median :5.633
#           Mean   :5.653
#           3rd Qu.:5.782
#           Max.   :6.243
Listing 36.11 showcases the exception handling of the log-transformations on the \(x\)- and \(y\)-coordinates-only point-pattern vesicles (Section 10.24).
log-transformations on 'none' mark-format
list(
  spatstat.data::vesicles |> log(),
  spatstat.data::vesicles |> log1p(),
  spatstat.data::vesicles |> log2(),
  spatstat.data::vesicles |> log10()
) |>
  vapply(FUN = identical, y = spatstat.data::vesicles, FUN.VALUE = NA) |>
  stopifnot()
36.3.2 Summary
Package groupedHyperframe (v0.4.0, GPL-2) implements the following S3 methods (Table 36.4) of the Summary-groupGeneric,
S3 methods of methods::Summary (v4.5.3)
| visible | isS4 | |
|---|---|---|
Summary.ppp |
FALSE | FALSE |
Summary.psp |
FALSE | FALSE |
Summary.quosure |
FALSE | FALSE |
Summary.roman |
FALSE | FALSE |
Summary.sparse3Darray |
FALSE | FALSE |
Summary.Surv |
FALSE | FALSE |
Summary.Surv2 |
FALSE | FALSE |
Summary.tess |
FALSE | FALSE |
Summary.unit |
FALSE | FALSE |
Summary.UUID |
FALSE | FALSE |
Summary.vctrs_sclr |
FALSE | FALSE |
Summary.vctrs_vctr |
FALSE | FALSE |
Summary.yearmon |
FALSE | FALSE |
Summary.yearqtr |
FALSE | FALSE |
The S3 method Summary.ppp() summarizes one or more numeric marks of a point-pattern. This function, as well as the S3 method Summary.tess() (Section 42.1.2), serves a similar purpose (Table 36.5) to the S3 methods Summary.fv() (v3.8.0, GPL (>= 2)) and Summary.im() (v3.7.3, GPL (>= 2)).
Summary Group-Generic
Summary.ppp() |
Summary.tess() |
Summary.fv() |
Summary.im() |
|
|---|---|---|---|---|
| Input | ppp.object (Chapter 36) |
tessellation (Chapter 42) |
fv.object (Chapter 20) |
im.object (Chapter 28) |
| Operates On | each numeric mark(s) | each numeric mark(s) | all function-values (Listing 20.12) | “grey value” at each pixel |
Listing 36.12 and Listing 36.13 find the minimum and the range of the numeric mark in the point-pattern bronzefilter (Section 10.5) with 'vector' mark-format.
'vector' mark-format
spatstat.data::bronzefilter |>
  min()
# [1] 0.013'vector' mark-format
spatstat.data::bronzefilter |>
  range()
# [1] 0.013 0.467
Listing 36.14 - Listing 36.17 find the minimum and the range of the numeric mark(s) in the point-patterns betacells (Section 10.4) and finpines (Section 10.11) with 'dataframe' mark-format.
'dataframe' mark-format
spatstat.data::betacells |>
  min()
#  area
# 168.3'dataframe' mark-format
spatstat.data::betacells |>
  range()
# $area
# [1] 168.3 514.4'dataframe' mark-format
spatstat.data::finpines |>
  min()
# diameter   height
# 0.0 0.8'dataframe' mark-format
spatstat.data::finpines |>
  range()
# $diameter
# [1] 0 7
#
# $height
# [1] 0.8 5.4
Listing 36.18 showcases the exception handling with an \(x\)- and \(y\)-coordinates-only point-pattern vesicles (Section 10.24).
'none' mark-format
spatstat.data::vesicles |>
  min() |>
  is.null() |> stopifnot()
spatstat.data::vesicles |>
  range() |>
  is.null() |> stopifnot()
36.4 Kernel Density (Estimates) of Numeric Mark(s)
The S3 generic function density_marks() finds the kernel densities (Becker et al. 1988) of the numeric mark(s). Package groupedHyperframe (v0.4.0, GPL-2) implements the following S3 methods (Table 36.6),
S3 methods of groupedHyperframe::density_marks (v0.4.0)
| visible | generic | isS4 | |
|---|---|---|---|
density_marks.ppp |
FALSE | groupedHyperframe::density_marks |
FALSE |
The S3 method density_marks.ppp() finds the kernel densities of one or more numeric marks in a point-pattern. Table 36.7 shows the difference between the S3 methods density_marks.ppp() and density.ppp() (v3.8.0, GPL (>= 2)),
density_marks.ppp() versus density.ppp()
density.ppp() |
density_marks.ppp() |
|
|---|---|---|
| Computes | fixed-bandwidth kernel estimate (Diggle 1985) of the intensity function from a point-pattern, i.e., the \(x\)- and \(y\)-coords only (Listing 36.29) |
kernel density (Becker et al. 1988) of the numeric mark(s) |
| Returns | an im.object (Chapter 28) |
a (list of) density object(s) |
The S3 method kerndens.ppp() (Section 33.1, Table 33.2) finds the kernel density estimates of one or more numeric marks of a point-pattern; this is simply a wrapper of the S3 method density_marks.ppp().
Listing 36.19 and Listing 36.20 showcase the exception handling for the \(x\)- and \(y\)-coordinates-only point-pattern vesicles (Section 10.24).
density_marks.ppp() on 'none' mark-format
spatstat.data::vesicles |>
  density_marks() |>
is.null() |> stopifnot()kerndens.ppp() on 'none' mark-format
spatstat.data::vesicles |>
  kerndens() |>
  is.null() |> stopifnot()
Listing 36.21 and Listing 36.22 showcase the exception handling for the point-pattern ants (Section 10.2) with one multi-type mark.
density_marks.ppp() on multi-type mark in 'vector' mark-format
spatstat.data::ants |>
  density_marks() |>
is.null() |> stopifnot()kerndens.ppp() on multi-type mark in 'vector' mark-format
spatstat.data::ants |>
  kerndens() |>
  is.null() |> stopifnot()
Listing 36.23 and Listing 36.24 find the kernel density (estimates) of the numeric mark in the point-pattern longleaf (Section 10.17).
density_marks.ppp() on numeric mark in 'vector' mark-format
spatstat.data::longleaf |>
  density_marks()
#
# Call:
#   density.default(x = m)
#
# Data: m (584 obs.);   Bandwidth 'bw' = 4.615
#
#        x                y
#  Min.   :-11.84   Min.   :1.759e-06
#  1st Qu.: 13.55   1st Qu.:1.665e-03
#  Median : 38.95   Median :1.227e-02
#  Mean   : 38.95   Mean   :9.823e-03
#  3rd Qu.: 64.35   3rd Qu.:1.624e-02
# Max. : 89.74 Max. :2.320e-02kerndens.ppp() on numeric mark in 'vector' mark-format
spatstat.data::longleaf |>
  kerndens(n = 8L)
# [1] 8.403103e-05 2.019181e-02 1.471192e-02 1.438080e-02 1.612033e-02 4.244355e-03 6.127754e-04 1.759222e-06
Listing 36.25 and Listing 36.26 find the kernel density (estimates) of the numeric mark area in the point-pattern betacells (Section 10.4).
density_marks.ppp() on numeric mark(s) in 'dataframe' mark-format
spatstat.data::betacells |>
  density_marks()
# $area
#
# Call:
#   density.default(x = `$area`)
#
# Data: $area (135 obs.);   Bandwidth 'bw' = 18.99
#
#        x               y
#  Min.   :111.3   Min.   :1.736e-06
#  1st Qu.:226.3   1st Qu.:1.385e-04
#  Median :341.4   Median :9.455e-04
#  Mean   :341.4   Mean   :2.170e-03
#  3rd Qu.:456.4   3rd Qu.:4.087e-03
# Max. :571.4 Max. :7.065e-03kerndens.ppp() on numeric mark(s) in 'dataframe' mark-format
spatstat.data::betacells |>
  kerndens(n = 8L)
# [1] 2.530826e-06 9.483771e-04 6.254928e-03 5.117580e-03 2.486671e-03 6.781429e-04 1.411284e-04 1.736171e-06
Listing 36.27 and Listing 36.28 find the kernel density (estimates) of the two numeric marks diameter and height in the point-pattern finpines (Section 10.11).
density_marks.ppp() on two numeric marks in 'dataframe' mark-format
spatstat.data::finpines |>
  density_marks()
# $diameter
#
# Call:
#   density.default(x = `$diameter`)
#
# Data: $diameter (126 obs.);   Bandwidth 'bw' = 0.5106
#
#        x                 y
#  Min.   :-1.5318   Min.   :0.0003457
#  1st Qu.: 0.9841   1st Qu.:0.0352813
#  Median : 3.5000   Median :0.0574541
#  Mean   : 3.5000   Mean   :0.0991600
#  3rd Qu.: 6.0159   3rd Qu.:0.1973683
#  Max.   : 8.5318   Max.   :0.2662931
#
# $height
#
# Call:
#   density.default(x = `$height`)
#
# Data: $height (126 obs.); Bandwidth 'bw' = 0.3912
#
#        x                 y
#  Min.   :-0.3736   Min.   :0.0001153
#  1st Qu.: 1.3632   1st Qu.:0.0228185
#  Median : 3.1000   Median :0.1429140
#  Mean   : 3.1000   Mean   :0.1436587
#  3rd Qu.: 4.8368   3rd Qu.:0.2651729
# Max. : 6.5736 Max. :0.2887832kerndens.ppp() on two numeric marks in 'dataframe' mark-format
spatstat.data::finpines |>
  kerndens(n = 8L)
# $diameter
# [1] 0.0005538254 0.0725488203 0.2527530420 0.2070950918 0.0839416301 0.0522232298 0.0348548329 0.0003456594
#
# $height
# [1] 0.0001987181 0.0487205156 0.2799629521 0.2648249560 0.2431292593 0.1364985536 0.0271086981 0.0001152871
Listing 36.29 shows that the S3 method density.ppp() (v3.8.0, GPL (>= 2)) only uses the \(x\)-and-\(y\) coordinates of a point-pattern.
density.ppp()
a1 = spatstat.data::betacells |>
  spatstat.explore::density.ppp()
a0 = spatstat.data::betacells |>
  spatstat.geom::unmark.ppp() |>
  spatstat.explore::density.ppp()
stopifnot(identical(a0, a1))
36.5 Quantile of Numeric Mark(s)
Package groupedHyperframe (v0.4.0, GPL-2) implements the following S3 methods (Table 36.8) of the generic function quantile(),
S3 methods of stats::quantile (v4.5.3)
| visible | isS4 | |
|---|---|---|
quantile.default |
FALSE | FALSE |
quantile.ecdf |
FALSE | FALSE |
quantile.POSIXt |
FALSE | FALSE |
quantile.ppp |
FALSE | FALSE |
quantile.quosure |
FALSE | FALSE |
quantile.Surv |
FALSE | FALSE |
quantile.survfit |
FALSE | FALSE |
quantile.survfitms |
FALSE | FALSE |
quantile.vctrs_vctr |
FALSE | FALSE |
quantile.zoo |
FALSE | FALSE |
The S3 method quantile.ppp() finds the quantiles of one or more numeric marks in a point-pattern. This is completely different from the S3 method SpatialQuantile.ppp() (v3.8.0, GPL (>= 2)).
Listing 36.30 showcases the exception handling for the \(x\)- and \(y\)-coordinates-only point-pattern vesicles (Section 10.24).
quantile.ppp() on 'none' mark-format
spatstat.data::vesicles |>
  quantile() |>
  is.null() |> stopifnot()
Listing 36.31 showcases the exception handling for the point-pattern ants (Section 10.2) with one multi-type mark.
quantile.ppp() on multi-type mark in 'vector' mark-format
spatstat.data::ants |>
  quantile() |>
  is.null() |> stopifnot()
Listing 36.32 finds the quantiles of the numeric mark in the point-pattern longleaf (Section 10.17).
quantile.ppp() on numeric mark in 'vector' mark-format
spatstat.data::longleaf |>
  quantile()
#     0%    25%    50%    75%   100%
#  2.000  9.100 26.150 42.125 75.900
Listing 36.33 finds the quantiles of the numeric mark area in the point-pattern betacells (Section 10.4).
quantile.ppp() on numeric mark(s) in 'dataframe' mark-format
spatstat.data::betacells |>
  quantile()
#     0%    25%    50%    75%   100%
# 168.30 248.85 279.40 324.25 514.40
Listing 36.34 finds the quantiles of the two numeric marks diameter and height in the point-pattern finpines (Section 10.11).
quantile.ppp() on two numeric marks in 'dataframe' mark-format
spatstat.data::finpines |>
  quantile()
# $diameter
#   0%  25%  50%  75% 100%
#    0    1    2    3    7
#
# $height
#    0%   25%   50%   75%  100%
# 0.800 1.825 2.850 3.600 5.400
36.6 Nearest Neighbour Distance of Multi-Type Marks, Alternative Interface
The function .nncross() is a wrapper of the function nncross(., what = 'dist') (v3.7.3, GPL (>= 2), Listing 36.37) to provide a user-interface (Listing 36.35) consistent with the function Gcross() (v3.8.0, GPL (>= 2), Listing 36.36), etc.
.nncross()
.nncross
# function(X, i, j, ...) {
# ✂️ --- output truncated --- ✂️Gcross()
spatstat.explore::Gcross
# function (X, i, j, r = NULL, breaks = NULL, ..., rmax = NULL,
#     correction = c("rs", "km", "han"))
# ✂️ --- output truncated --- ✂️nncross()
spatstat.geom::nncross
# function (X, Y, ...)
# ✂️ --- output truncated --- ✂️
Listing 36.38 computes the distance to the nearest neighbour of points with 'Messor'-mark from each point with 'Cataglyphis'-mark in the point-pattern ants (Section 10.2) by using the functions split.ppp() and nncross.ppp()(v3.7.3, GPL (>= 2)).
nncross.ppp()
nn = spatstat.data::ants |>
  spatstat.geom::split.ppp() |>
  with.default(expr = {
    spatstat.geom::nncross.ppp(X = Cataglyphis, Y = Messor, what = 'dist')
  })
Listing 36.39 creates an identical return as Listing 36.38 using the function .nncross() with integer indices corresponding to the levels of the multi-type marks in ants (Section 10.2), i.e, 1L for 'Cataglyphis' and 2L for 'Messor'.
.nncross() with integer levels indices
spatstat.data::ants |>
  .nncross(i = 1L, j = 2L) |>
  identical(y = nn) |>
  stopifnot()
Listing 36.40 creates an identical return as Listing 36.38 using the function .nncross() with character levels of the multi-type marks in the point-pattern ants (Section 10.2).
.nncross() with character levels
spatstat.data::ants |>
  .nncross(i = 'Cataglyphis', j = 'Messor') |>
  identical(y = nn) |>
  stopifnot()
Listing 36.41 showcases the exception handling when the character values supplied to the i and j parameters do not match any levels of the multi-type marks in the point-pattern ants (Section 10.2).
.nncross(), non-existing levels
spatstat.data::ants |>
  .nncross(i = 'a', j = 'b') |>
  is.null() |> stopifnot()
36.7 Aggregate Marks-Statistics
The S3 generic function aggregate_marks() aggregates various statistics (other than the quantiles, Section 36.5) of the marks within a point-pattern, or within each point-pattern of an object containing one or more point-patterns. Package groupedHyperframe (v0.4.0, GPL-2) implements the following S3 methods (Table 36.9),
S3 methods of groupedHyperframe::aggregate_marks (v0.4.0)
| visible | generic | isS4 | |
|---|---|---|---|
aggregate_marks.ppp |
FALSE | groupedHyperframe::aggregate_marks |
FALSE |
The S3 method aggregate_marks.ppp() aggregates a set of fully customizable summary statistics, in the parameter FUN or expr, of the marks within a point-pattern. For each type of the mark-format of the input point-pattern,
markformat = 'none'(Section 36.7.1): returns aninvisibleNULL-value.markformat = 'vector'(Section 36.7.2): computes the summary statistics of the numeric- or multi-type marks.markformat = 'dataframe'(Section 36.7.3): aggregates the numeric- and/or multi-type marks, according to a grouping structure determined by one-or-more multi-type-marks in the parameterby(Section 36.7.3.1), using the workhorse functionaggregate.data.frame().
The returned aggregated summary statistics can be vectorized for downstream use (Section 26.2.2).
Table 36.10 explains how the S3 method aggregate_marks.ppp() generalizes the aggregation-of-marks, compared to the S3 method summary.ppp() (v3.7.3, GPL (>= 2)).
aggregate_marks.ppp() versus summary.ppp()
aggregate_marks.ppp() |
summary.ppp() |
|
|---|---|---|
| Summary of \(x\)- and \(y\)-Coordinates | No | Yes |
| Summary of Observation Window | No | Yes |
| Mark(s) Statistics | Fully customizable in parameters FUN or expr |
Only those available in function summary.default() |
| By Group(s) | Yes (Section 36.7.3.1) | No (Listing 36.54) |
| Returns | a list or vector |
a summary.ppp object (Listing 36.42) |
Listing 36.42 summarizes the S3 methods for the class 'summary.ppp' in the spatstat.* family of packages.
S3 methods spatstat.*::*.summary.ppp
Code
library(spatstat)
.S3methods(class = 'summary.ppp', all.names = TRUE) |>
  attr(which = 'info', exact = TRUE) |>
  subset.data.frame(subset = grepl(pattern = '^spatstat\\.', x = from))
#                   visible          from generic  isS4
# print.summary.ppp    TRUE spatstat.geom   print FALSE
36.7.1 'none' mark-format
Listing 36.43 showcases the exception handling with the point-pattern vesicles (Section 10.24) without any mark.
aggregate_marks.ppp() on 'none' mark-format
spatstat.data::vesicles |>
  aggregate_marks() |>
  is.null() |> stopifnot()
Listing 36.44 shows the S3 method summary.ppp() (v3.7.3, GPL (>= 2)) on a point-pattern without any mark.
summary.ppp() on 'none' mark-format
spatstat.data::vesicles |>
  spatstat.geom::summary.ppp() |>
  getElement(name = 'marks') |>
  is.null() |> stopifnot()
36.7.2 'vector' mark-format
Listing 36.45, Listing 36.46 and Listing 36.47 aggregate the sample mean, or both the sample mean and the sample standard deviation, or the common summary statistics, of the numeric mark in the point-pattern spruces (Section 10.21). The parameter z in Listing 36.46 represents the numeric mark as a vector, and may be replaced by any other symbol of the user’s choice.
mean
spatstat.data::spruces |>
  aggregate_marks(FUN = mean)
#      mean
# 0.2503731mean and sd
spatstat.data::spruces |>
  aggregate_marks(FUN = \(z) c(mean = mean(z), sd = sd(z)))
#       mean         sd
# 0.25037313 0.04697474spatstat.data::spruces |>
aggregate_marks(FUN = summary.default)
# Min. 1st Qu. Median Mean 3rd Qu. Max.
# 0.1600000 0.2200000 0.2450000 0.2503731 0.2700000 0.3700000Listing 36.48 provides equivalent return as Listing 36.47 using the S3 method summary.ppp()(v3.7.3, GPL (>= 2)).
summary.ppp(), numeric mark in 'vector' mark-format
spatstat.data::spruces |>
  spatstat.geom::summary.ppp() |>
  getElement(name = 'marks')
#    Min. 1st Qu.  Median    Mean 3rd Qu.    Max.
#  0.1600  0.2200  0.2450  0.2504  0.2700  0.3700
Listing 36.49 and Listing 36.50 aggregate the (relative) frequencies of the multi-type mark in the point-pattern ants (Section 10.2). The parameter z in Listing 36.50 represents the multi-type mark as a vector, and may be replaced by any other symbol of the user’s choice.
spatstat.data::ants |>
  aggregate_marks(FUN = table)
# Cataglyphis      Messor
# 29 68spatstat.data::ants |>
aggregate_marks(FUN = \(z) table(z)/length(z))
# Cataglyphis Messor
# 0.2989691 0.7010309Listing 36.51 provides equivalent return as Listing 36.49 and Listing 36.50 using the S3 method summary.ppp()(v3.7.3, GPL (>= 2)).
summary.ppp(), multi-type mark in 'vector' mark-format
spatstat.data::ants |>
  spatstat.geom::summary.ppp() |>
  getElement(name = 'marks')
#             frequency proportion    intensity
# Cataglyphis        29  0.2989691 6.761144e-05
# Messor             68  0.7010309 1.585372e-04
36.7.3 'dataframe' mark-format
Listing 36.52 aggregates the numeric mark area and multi-type mark type in the point-pattern betacells (Section 10.4) using the statistics specified as R language in the parameter expr.
'dataframe' mark-format
spatstat.data::betacells |>
  aggregate_marks(expr = list(
    type = table(type),
    area = summary.default(area)
  ))
# $type
# type
# off  on
#  70  65
#
# $area
#    Min. 1st Qu.  Median    Mean 3rd Qu.    Max.
#   168.3   248.8   279.4   291.2   324.2   514.4
Listing 36.53 vectorizes the return of Listing 36.52.
'dataframe' mark-format, vectorized
spatstat.data::betacells |>
  aggregate_marks(expr = list(
    type = table(type),
    area = summary.default(area)
  ), vectorize = TRUE)
#     type.off      type.on    area.Min. area.1st Qu.  area.Median    area.Mean area.3rd Qu.    area.Max.
#      70.0000      65.0000     168.3000     248.8500     279.4000     291.2081     324.2500     514.4000
Listing 36.54 provides equivalent return as Listing 36.52 and Listing 36.53 using the S3 method summary.ppp()(v3.7.3, GPL (>= 2)).
summary.ppp(), numeric and multi-type mark in 'dataframe' mark-format
spatstat.data::betacells |>
  spatstat.geom::summary.ppp() |>
  getElement(name = 'marks')
#   type         area
#  off:70   Min.   :168.3
#  on :65   1st Qu.:248.8
#           Median :279.4
#           Mean   :291.2
#           3rd Qu.:324.2
#           Max.   :514.4
36.7.3.1 Use of Parameter by
The S3 method aggregate_marks.ppp() accepts a two-sided formula for the parameter by, if the input point-pattern has 'dataframe' mark-format. The left-hand-side of the formula by contains the name(s) of one or more mark(s) to be summarized, e.g.,
- the numeric mark
areaof the point-patternbetacells(Section 10.4) in Listing 36.55, Listing 36.56, Listing 36.57, Listing 36.58. - the multi-type mark
seasonof the point-patterngorillas(Section 10.13) in Listing 36.59, Listing 36.60, Listing 36.61, Listing 36.62. - the
log1p-transformed numeric markfnl.sizeof the point-patternnbfL(Listing 36.63) in Listing 36.64, Listing 36.66. - the
log1p-transformed numeric marksfnl.sizeandhr.lastof the point-patternnbfL(Listing 36.63) in Listing 36.65, Listing 36.67.
The right-hand-side of the formula by contains the name(s) of one or more multi-type mark(s) to indicate the grouping structure of the aggregation, e.g.,
- by the multi-type mark
~typeof the point-patternbetacells(Section 10.4) in Listing 36.55, Listing 36.56, Listing 36.57, Listing 36.58. - by the multi-type mark
~groupof the point-patterngorillas(Section 10.13) in Listing 36.59, Listing 36.60, Listing 36.61, Listing 36.62. - by the interaction of two multi-type marks
~fire.type:causeof the point-patternnbfL(Listing 36.63) in Listing 36.64, Listing 36.65, Listing 36.66, Listing 36.67.
Note that the S3 method summary.ppp() (v3.7.3, GPL (>= 2)) does not provide summary statistics by-group (Listing 36.54).
36.7.3.1.1 Aggregate by One Group
Listing 36.55 and Listing 36.56 aggregate the numeric mark area by the multi-type mark type of the point-pattern betacells (Section 10.4), using the sample mean, or both the sample mean and the sample standard deviation. The parameter z in Listing 36.56 represents the numeric mark area in the left-hand-side of the formula by, and may be replaced by any other symbol of the user’s choice.
mean of area-by-type
spatstat.data::betacells |>
  aggregate_marks(by = area ~ type, FUN = mean)
#   type     area
# 1  off 259.7214
# 2 on 325.1169mean and sd of area-by-type
spatstat.data::betacells |>
  aggregate_marks(by = area ~ type, FUN = \(z) {
    c(mean = mean(z), sd = sd(z))
  })
#   type area.mean   area.sd
# 1  off 259.72143  40.86083
# 2   on 325.11692  60.71534
Listing 36.57 and Listing 36.58 vectorize the returns of Listing 36.55 and Listing 36.56.
mean of area-by-type, vectorized
spatstat.data::betacells |>
  aggregate_marks(by = area ~ type, FUN = mean, vectorize = TRUE)
# off.area  on.area
# 259.7214 325.1169mean and sd of area-by-type, vectorized
spatstat.data::betacells |>
  aggregate_marks(by = area ~ type, FUN = \(z) {
    c(mean = mean(z), sd = sd(z))
  }, vectorize = TRUE)
# off.area.mean   off.area.sd  on.area.mean    on.area.sd
#     259.72143      40.86083     325.11692      60.71534
Listing 36.59 and Listing 36.60 aggregate one multi-type mark season by another multi-type mark group of the point-pattern gorillas (Section 10.13), using the (relative) frequencies. The parameter z in Listing 36.60 represents the multi-type mark season in the left-hand-side of the formula by, and may be replaced by any other symbol of the user’s choice.
season-by-group
spatstat.data::gorillas |>
  aggregate_marks(by = season ~ group, FUN = table)
#   group season.dry season.rainy
# 1 major        150          200
# 2 minor 125 172season-by-group
spatstat.data::gorillas |>
  aggregate_marks(by = season ~ group, FUN = \(z) table(z)/length(z))
#   group season.dry season.rainy
# 1 major  0.4285714    0.5714286
# 2 minor  0.4208754    0.5791246
Listing 36.61 and Listing 36.62 vectorize the returns of Listing 36.59 and Listing 36.60.
season-by-group, vectorized
spatstat.data::gorillas |>
  aggregate_marks(by = season ~ group, FUN = table, vectorize = TRUE)
#   major.season.dry major.season.rainy   minor.season.dry minor.season.rainy
# 150 200 125 172season-by-group, vectorized
spatstat.data::gorillas |>
  aggregate_marks(by = season ~ group, FUN = \(z) {
    table(z)/length(z)
  }, vectorize = TRUE)
#   major.season.dry major.season.rainy   minor.season.dry minor.season.rainy
#          0.4285714          0.5714286          0.4208754          0.5791246
36.7.3.1.2 Aggregate One-or-More Marks by Interaction of Multiple Groups
Listing 36.63 creates a point-pattern nbfL from the point-pattern nbfires (Section 10.19) by
- appending a numeric mark
hr.last(Section 36.8), the time difference in hours between the put-outout.dateand the discoverydis.date, to the existing marks; - selecting a subset of points that represent
'forest'and/or'grass'fires caused by railroads'rrds'and/or recreation'rec'; - removing the points with any missing marks (Section 36.1);
- performing
log1p-transformations on the numeric marks (Section 36.3.1)fnl.sizeandhr.last.
nbfL
nbfL. = spatstat.data::nbfires
append_marks(nbfL.) = nbfL. |>
  spatstat.geom::marks.ppp() |>
  with.default(expr = {
    tmp = out.date - dis.date
    units(tmp) = 'hours'
    list(hr.last = as.numeric(tmp))
  })
nbfL = nbfL. |>
  spatstat.geom::subset.ppp(
    subset = (fire.type %in% c('forest', 'grass')) & (cause %in% c('rrds', 'rec')),
    select = c('fire.type', 'cause', 'fnl.size', 'hr.last')
  ) |>
  na.omit() |>
  log1p()
rm(nbfL.)
Listing 36.64 aggregates the log1p-transformed numeric mark fnl.size by the interaction of two multi-type marks fire.type and cause in the point-pattern nbfL (Listing 36.63), using the sample mean and the sample standard deviation sd. The parameter z in Listing 36.64 represents the log1p-transformed numeric mark fnl.size in the left-hand-side of the formula by, and may be replaced by any other symbol of the user’s choice.
mean and sd of log1p-transformed fnl.size-by-fire.type:cause (Listing 36.63)
nbfL |>
  aggregate_marks(by = fnl.size ~ fire.type:cause, FUN = \(z) {
    c(mean = mean(z), sd = sd(z))
  })
#   fire.type cause fnl.size.mean fnl.size.sd
# 1    forest  rrds     0.8647287   0.9269129
# 2     grass  rrds     0.3416982   0.4392035
# 3    forest   rec     0.4799249   0.7390220
# 4     grass   rec     0.3740750   0.5717532
Listing 36.65 aggregates the log1p-transformed numeric marks fnl.size and hr.last by the interaction of two multi-type marks fire.type and cause in the point-pattern nbfL (Listing 36.63), using the sample mean and the sample standard deviation sd. The parameter z in Listing 36.65 represents the log1p-transformed numeric marks fnl.size and hr.last, respectively, in the left-hand-side of the formula by, and may be replaced by any other symbol of the user’s choice. Note that the use of cbind() in the formula by follows that of the S3 method aggregate.data.frame().
mean and sd of log1p-transformed fnl.size-and-hr.last-by-fire.type:cause (Listing 36.63)
nbfL |>
  aggregate_marks(by = cbind(fnl.size, hr.last) ~ fire.type:cause, FUN = \(z) {
    c(mean = mean(z), sd = sd(z))
  })
#   fire.type cause fnl.size.mean fnl.size.sd hr.last.mean hr.last.sd
# 1    forest  rrds     0.8647287   0.9269129    3.2775133  1.0379506
# 2     grass  rrds     0.3416982   0.4392035    2.1677729  1.1694497
# 3    forest   rec     0.4799249   0.7390220    2.7868615  1.3290827
# 4     grass   rec     0.3740750   0.5717532    1.3526997  0.9957785
Listing 36.66 and Listing 36.67 vectorize the returns of Listing 36.64 and Listing 36.65.
mean and sd of log1p-transformed fnl.size-by-fire.type:cause, vectorized (Listing 36.63)
nbfL |>
  aggregate_marks(by = fnl.size ~ fire.type:cause, FUN = \(z) {
    c(mean = mean(z), sd = sd(z))
  }, vectorize = TRUE)
# forest.rrds.fnl.size.mean   forest.rrds.fnl.size.sd  grass.rrds.fnl.size.mean    grass.rrds.fnl.size.sd  forest.rec.fnl.size.mean    forest.rec.fnl.size.sd   grass.rec.fnl.size.mean
#                 0.8647287                 0.9269129                 0.3416982                 0.4392035                 0.4799249                 0.7390220                 0.3740750
#     grass.rec.fnl.size.sd
# 0.5717532mean and sd of log1p-transformed fnl.size-and-hr.last-by-fire.type:cause, vectorized (Listing 36.63)
nbfL |>
  aggregate_marks(by = cbind(fnl.size, hr.last) ~ fire.type:cause, FUN = \(z) {
    c(mean = mean(z), sd = sd(z))
  }, vectorize = TRUE)
# forest.rrds.fnl.size.mean   forest.rrds.fnl.size.sd  forest.rrds.hr.last.mean    forest.rrds.hr.last.sd  grass.rrds.fnl.size.mean    grass.rrds.fnl.size.sd   grass.rrds.hr.last.mean
#                 0.8647287                 0.9269129                 3.2775133                 1.0379506                 0.3416982                 0.4392035                 2.1677729
#     grass.rrds.hr.last.sd  forest.rec.fnl.size.mean    forest.rec.fnl.size.sd   forest.rec.hr.last.mean     forest.rec.hr.last.sd   grass.rec.fnl.size.mean     grass.rec.fnl.size.sd
#                 1.1694497                 0.4799249                 0.7390220                 2.7868615                 1.3290827                 0.3740750                 0.5717532
#    grass.rec.hr.last.mean      grass.rec.hr.last.sd
#                 1.3526997                 0.9957785
36.8 Append to (Existing) Marks
The S3 generic syntactic sugar `append_marks<-` appends additional mark(s) to the existing marks. Package groupedHyperframe (v0.4.0, GPL-2) implements the following S3 methods (Table 36.11),
S3 methods of groupedHyperframe::`append_marks<-` (v0.4.0)
| visible | isS4 | |
|---|---|---|
append_marks<-.ppp |
FALSE | FALSE |
append_marks<-.psp |
FALSE | FALSE |
append_marks<-.tess |
FALSE | FALSE |
The S3 method `append_marks<-.ppp` appends additional mark(s) to (the existing marks of) a point-pattern. Table 36.12 summarizes the differences of the S3 methods `append_marks<-.ppp` versus `marks<-.ppp` (v3.7.3, GPL (>= 2)).
`append_marks<-.ppp` versus `marks<-.ppp`
`append_marks<-.ppp` |
`marks<-.ppp` |
|
|---|---|---|
| Existing Mark(s) | appends additional mark(s) to existing mark(s) | overwrites existing mark(s) using additional mark(s), e.g., Listing 36.71 |
| Number of Points | denoted by dot (.) |
user needs to obtain manually using the function npoints.ppp, e.g., Listing 36.69, Listing 36.71 |
Listing 36.68 appends a random log-normal mark to the point-pattern vesicles (Section 10.24) without any existing mark. Listing 36.69 creates identical return as Listing 36.68 using the S3 method `marks<-.ppp` (v3.7.3, GPL (>= 2)).
`append_marks<-.ppp`, no existing marks
ves = spatstat.data::vesicles
set.seed(12); append_marks(ves) = quote(rlnorm(n = .))
ves
# Marked planar point pattern: 37 points
# marks are numeric, of storage type  'double'
# window: polygonal boundary
# enclosing rectangle: [22.6796, 586.2292] x [11.9756, 1030.7] nm`marks<-.ppp`, no existing marks
Code
library(spatstat.geom)
# to put function spatstat.geom::`marks<-.ppp` on search path
ves. = spatstat.data::vesicles
set.seed(12); marks(ves.) = rlnorm(n = npoints.ppp(ves.))
stopifnot(identical(ves, ves.))
Listing 36.70 appends a random negative-binomial mark to the existing numeric mark in the point-pattern spruces (Section 10.21). Listing 36.71 does not create identical return as Listing 36.70, as the S3 method `marks<-.ppp` (v3.7.3, GPL (>= 2)) overwrites the existing mark.
`append_marks<-.ppp`, existing numeric marks
spru = spatstat.data::spruces
set.seed(23); append_marks(spru) = quote(rnbinom(n = ., size = 4, prob = .3))
spru
# Marked planar point pattern: 134 points
# Mark variables: m1, m2
# window: rectangle = [0, 56] x [0, 38] metres`marks<-.ppp`, existing numeric marks
Code
library(spatstat.geom)
spru. = spatstat.data::spruces
set.seed(23); marks(spru.) = rnbinom(n = npoints.ppp(spru.), size = 4, prob = .3)
spru.
# Marked planar point pattern: 134 points
# marks are numeric, of storage type  'integer'
# window: rectangle = [0, 56] x [0, 38] metres
Listing 36.72 appends a random log-normal mark to the existing multi-type mark in the point-pattern ants (Section 10.2).
`append_marks<-.ppp`, existing multi-type marks
ant = spatstat.data::ants
set.seed(42); append_marks(ant) = quote(rlnorm(n = .))
ant
# Marked planar point pattern: 97 points
# Mark variables: m1, m2
# window: polygonal boundary
# enclosing rectangle: [-25, 803] x [-49, 717] units (one unit = 0.5 feet)
Listing 36.73 appends a random log-normal mark to the three existing marks of the point-pattern gorillas (Section 10.13). The new mark is automatically named m4.
`append_marks<-.ppp`, existing 'dataframe' marks
goril_a = spatstat.data::gorillas
set.seed(33); append_marks(goril_a) = quote(rlnorm(n = .))
goril_a
# Marked planar point pattern: 647 points
# Mark variables: group, season, date, m4
# window: polygonal boundary
# enclosing rectangle: [580457.9, 585934] x [674172.8, 678739.2] metres
Listing 36.74 appends two random log-normal marks, with user-specified mark names, to the three existing marks of the point-pattern gorillas (Section 10.13).
`append_marks<-.ppp`, existing 'dataframe' marks, multiple new marks
goril_b = spatstat.data::gorillas
set.seed(33); append_marks(goril_b) = replicate(n = 2L, expr = rlnorm(n = .), simplify = FALSE) |>
  setNames(nm = c('new1', 'new2')) |>
  quote()
goril_b
# Marked planar point pattern: 647 points
# Mark variables: group, season, date, new1, new2
# window: polygonal boundary
# enclosing rectangle: [580457.9, 585934] x [674172.8, 678739.2] metres
36.9 Default \(r_\text{max}\)
The S3 generic function .rmax() provides the default \(r_\text{max}\) used in functions from package spatstat.explore (v3.8.0, GPL (>= 2)) that return a function-value-table (fv.object, Chapter 20), i.e., the workhorse functions in Table 36.22 and Table 36.24. Package groupedHyperframe (v0.4.0, GPL-2) implements the following S3 methods (Table 36.13),
S3 methods of groupedHyperframe::.rmax (v0.4.0)
| visible | isS4 | |
|---|---|---|
.rmax.fv |
FALSE | FALSE |
.rmax.ppp |
FALSE | FALSE |
The S3 method .rmax.ppp() finds the default \(r_\text{max}\) used by various functions applicable to a point-pattern and returning a function-value-table. It is
Table 36.14: an off-label use of functions spatstat.explore::rmax.rule() and spatstat.geom::handle.r.b.args()
spatstat.explore (v3.8.0, GPL (>= 2)) that return an fv.object
Function from package spatstat.explore |
Call of spatstat.explore::rmax.rule |
Default \(r_\text{max}\) via .rmax() |
|---|---|---|
markcorr, the workhorse function of Emark and Vmark, markvario |
rmax.rule(fun = 'K', ...) |
.rmax(fun = 'K') |
Kinhom, the workhorse function of Kmark and markcorrint |
rmax.rule(fun = 'K', ...) |
.rmax(fun = 'K') |
Kcross, and its workhorse functions Kest and Kmulti |
rmax.rule(fun = 'K', ...) |
.rmax(fun = 'K') or .rmax(fun = 'K', i, j) |
Gcross, and its workhorse functions Gest and Gmulti |
rmax.rule(fun = 'G', ...) |
.rmax(fun = 'G') or .rmax(fun = 'G', i, j) |
Jcross, and its workhorse functions Jest and Jmulti |
rmax.rule(fun = 'J', ...) |
.rmax(fun = 'J') or .rmax(fun = 'J', i, j) |
.rmax.ppp() for markcorr() on numeric mark
spatstat.data::spruces |>
  spatstat.explore::markcorr() |>
  .rmax() |>
  identical(y = spatstat.data::spruces |> .rmax(fun = 'K')) |>
stopifnot().rmax.ppp() for markcorr() on numeric marks in 'dataframe' mark-format
spatstat.data::finpines |>
  spatstat.explore::markcorr() |>
  vapply(FUN = .rmax, FUN.VALUE = NA_real_) |>
  vapply(
    FUN = identical,
    y = spatstat.data::finpines |> .rmax(fun = 'K'),
    FUN.VALUE = NA
  ) |>
stopifnot().rmax.ppp() for Gcross() on multi-type mark, character levels
spatstat.data::ants |>
  spatstat.explore::Gcross(i = 'Messor', j = 'Cataglyphis') |>
  .rmax() |>
  identical(
    y = spatstat.data::ants |>
      .rmax(fun = 'G', i = 'Messor', j = 'Cataglyphis')
  ) |>
  stopifnot()
36.10 \(k\)-Means Clustering
The function kmeans.ppp() performs \(k\)-means clustering (Hartigan and Wong 1979) on a point-pattern. This is a “pseudo” S3 method, as the workhorse function kmeans() (R version 4.5.3 (2026-03-11)) is not an S3 generic function. Note that to reproduce a kmeans() clustering, readers must set the .Random.seed beforehand.
The function kmeans.ppp() has parameters
formula, \(x\)- and/or \(y\)- coordinate(s) and/or (one or more of the) numeric marks- (optional)
centers, number of clusters - (optional)
clusterSize, “expected” number of points per cluster.
User should specify one of the two optional parameters centers and clusterSize. If both are specified, then parameter clusterSize takes priority and parameter centers is ignored.
The function kmeans.ppp() returns an object of S3 class 'pppkm', which inherits from the class 'ppp' and is assigned with additional attributes,
attr(.,'f'), afactorindicating the \(k\)-means clustering indices.
Package groupedHyperframe (v0.4.0, GPL-2) implements the following S3 methods to the class 'pppkm' (Table 36.15), most of which are straightforward extensions of the S3 methods for the class 'ppp' (Note 36.2).
S3 methods groupedHyperframe::*.pppkm (v0.4.0)
| visible | generic | isS4 | |
|---|---|---|---|
plot.pppkm |
FALSE | base::plot |
FALSE |
print.pppkm |
FALSE | base::print |
FALSE |
split.pppkm |
FALSE | base::split |
FALSE |
36.10.1 Print & Plot
Listing 36.78 performs 3L-means clustering on the \(x\)- and \(y\)-coordinates-only point-pattern vesicles (Section 10.24) by the \(x\)-coordinates.
kmeans.ppp(); cluster vesicles by ~ x
set.seed(12); spatstat.data::vesicles |>
kmeans.ppp(formula = ~ x, centers = 3L)
# Planar point pattern: 37 points
# window: polygonal boundary
# enclosing rectangle: [22.6796, 586.2292] x [11.9756, 1030.7] nm
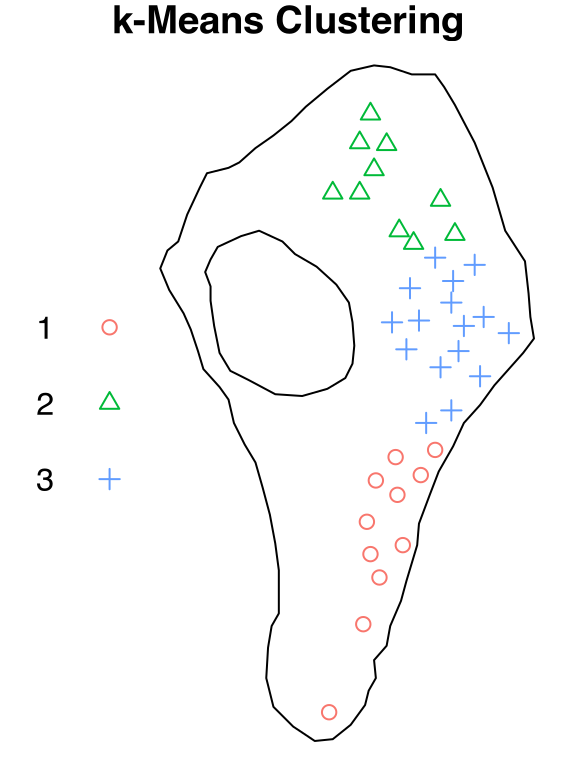
# with k-means clustering of 10, 15, 12 pointsListing 36.79 performs 3L-means clustering on vesicles (Section 10.24) by the \(x\)- and \(y\)-coordinates. Figure 36.1 visualizes the \(x\)- and \(y\)-coordinates and the 3L-means clustering indices.
kmeans.ppp(); cluster vesicles by ~ x + y
set.seed(21); vesicles_k2 = spatstat.data::vesicles |>
  kmeans.ppp(formula = ~ x + y, centers = 3L)
vesicles_k2
# Planar point pattern: 37 points
# window: polygonal boundary
# enclosing rectangle: [22.6796, 586.2292] x [11.9756, 1030.7] nm
# with k-means clustering of 11, 10, 16 pointsplot.pppkm(); cluster vesicles by ~ x + y
Code
par(mar = c(0,0,1,0))
vesicles_k2 |>
plot()vesicles by ~ x + y
Listing 36.81 performs \(k\)-means clustering on vesicles (Section 10.24) by the \(x\)- and \(y\)-coordinates, with an expected cluster size of 10L.
kmeans.ppp(); cluster vesicles by ~ x + y and parameter clusterSize
set.seed(43); spatstat.data::vesicles |>
  kmeans.ppp(formula = ~ x + y, clusterSize = 10L)
# Planar point pattern: 37 points
# window: polygonal boundary
# enclosing rectangle: [22.6796, 586.2292] x [11.9756, 1030.7] nm
# with k-means clustering of 9, 10, 12, 6 points
Listing 36.82 - Listing 36.83 perform 3L-means clustering in the point-pattern spruces (Section 10.21) with 'vector' mark-format.
kmeans.ppp(); cluster spruces by ~ x + marks
set.seed(30); spatstat.data::spruces |>
  kmeans.ppp(formula = ~ x + marks, centers = 3L)
# Marked planar point pattern: 134 points
# marks are numeric, of storage type  'double'
# window: rectangle = [0, 56] x [0, 38] metres
# with k-means clustering of 47, 39, 48 pointskmeans.ppp(); cluster spruces by ~ x + y + marks
set.seed(62); spatstat.data::spruces |>
  kmeans.ppp(formula = ~ x + y + marks, centers = 3L)
# Marked planar point pattern: 134 points
# marks are numeric, of storage type  'double'
# window: rectangle = [0, 56] x [0, 38] metres
# with k-means clustering of 40, 38, 56 points
Listing 36.84 - Listing 36.85 perform 3L-means clustering in the point-pattern finpines (Section 10.11) with 'dataframe' mark-format.
kmeans.ppp(); cluster finpines by ~ x + y + height
set.seed(18); spatstat.data::finpines |>
  kmeans.ppp(formula = ~ x + y + height, centers = 3L)
# Marked planar point pattern: 126 points
# Mark variables: diameter, height
# window: rectangle = [-5, 5] x [-8, 2] metres
# with k-means clustering of 38, 42, 46 pointskmeans.ppp(); cluster finpines by ~ x + diameter + height
set.seed(20); spatstat.data::finpines |>
  kmeans.ppp(formula = ~ x + diameter + height, centers = 3L)
# Marked planar point pattern: 126 points
# Mark variables: diameter, height
# window: rectangle = [-5, 5] x [-8, 2] metres
# with k-means clustering of 37, 45, 44 points
36.10.2 Split by \(k\)-Means Clustering
Package groupedHyperframe (v0.4.0, GPL-2) implements the following S3 methods of the generic function split() (R version 4.5.3 (2026-03-11)) (Table 36.16),
S3 methods of base::split (v4.5.3)
| visible | isS4 | |
|---|---|---|
split.data.table |
FALSE | FALSE |
split.hyperframekm |
FALSE | FALSE |
split.pppkm |
FALSE | FALSE |
split.zoo |
FALSE | FALSE |
The S3 method split.pppkm() (Listing 36.86) splits the \(k\)-means clustered point-pattern flu$pattern[[1L]] (Section 10.12) by its \(k\)-means clustering indices.
split.pppkm()
set.seed(15); spatstat.data::flu$pattern[[1L]] |>
  kmeans.ppp(formula = ~ x + y, centers = 3L) |>
  split()
# Point pattern split by factor
#
# 1:
# Marked planar point pattern: 169 points
# Multitype, with levels = M2, M1
# window: rectangle = [0, 3331] x [0, 3331] nm
#
# 2:
# Marked planar point pattern: 157 points
# Multitype, with levels = M2, M1
# window: rectangle = [0, 3331] x [0, 3331] nm
#
# 3:
# Marked planar point pattern: 145 points
# Multitype, with levels = M2, M1
# window: rectangle = [0, 3331] x [0, 3331] nm
36.11 Pairwise Tjøstheim (1978)’s Coefficient
The S3 generic function pairwise_cor_spatial() calculates the nonparametric, rank-based, Tjøstheim (1978)’s correlation coefficients (Hubert and Golledge 1982) in a pairwise-combination fashion, using the workhorse function SpatialPack::cor.spatial() (Vallejos et al. 2020, v0.4.1, GPL–3). Package groupedHyperframe (v0.4.0, GPL-2) implements the following S3 methods (Table 36.17),
S3 methods of groupedHyperframe::pairwise_cor_spatial (v0.4.0)
| visible | generic | isS4 | |
|---|---|---|---|
pairwise_cor_spatial.ppp |
FALSE | groupedHyperframe::pairwise_cor_spatial |
FALSE |
The S3 method pairwise_cor_spatial.ppp() finds the nonparametric Tjøstheim (1978)’s correlation coefficients from the pairwise-combinations of all numeric marks in a point-pattern, and returns an object of S3 class 'pairwise_cor_spatial', which inherits from the class 'dist' defined in package stats (R version 4.5.3 (2026-03-11)). Such inheritance, as well as the intrinsic similarity in data structure (Table 36.18), enables us to make use of the S3 methods to class 'dist', e.g., stats:::print.dist(), stats:::as.matrix.dist(), stats:::format.dist() and stats:::labels.dist(). Package groupedHyperframe (v0.4.0, GPL-2) implements the following S3 methods to the class 'pairwise_cor_spatial' (Table 36.19),
'pairwise_cor_spatial' & 'dist'
'pairwise_cor_spatial' object |
'dist' object |
|
|---|---|---|
Constant diagonal Values |
of 1; i.e., perfect correlation |
of 0; i.e., zero distance |
S3 methods groupedHyperframe::*.pairwise_cor_spatial (v0.4.0)
| visible | generic | isS4 | |
|---|---|---|---|
as.matrix.pairwise_cor_spatial |
FALSE | base::as.matrix |
FALSE |
The S3 method as.matrix.pairwise_cor_spatial() returns a matrix of pairwise Tjøstheim (1978)’s coefficients with diagonal values of 1. This matrix, however, is not a correlation matrix, because Tjøstheim (1978)’s correlation coefficient
- is nonparametric, i.e., there is no definition of the corresponding
covariance, standard deviationsd, nor the conversioncov2cormethod; - does not provide a mathematical mechanism to ensure that this matrix is positive definite.
Listing 36.87 creates a pairwise_cor_spatial object from the point-pattern finpines (Section 10.11).
pairwise_cor_spatial.ppp()
finpines_paircor = spatstat.data::finpines |>
  pairwise_cor_spatial()
Listing 36.88 prints finpines_paircor (Listing 36.87) using the S3 method stats:::print.dist().
pairwise_cor_spatial object finpines_paircor (Listing 36.87)
finpines_paircor
#         diameter
# height 0.7287879
Listing 36.89 converts finpines_paircor (Listing 36.87) into a matrix.
as.matrix.pairwise_cor_spatial() (Listing 36.87)
finpines_paircor |>
  as.matrix()
#           diameter    height
# diameter 1.0000000 0.7287879
# height   0.7287879 1.0000000
36.12 Random Re-Labelling Envelope Residual & Test
The S3 generic function rlabelRes() finds the residual form of the random re-labelling envelope (Baddeley et al. 2014; Myllymäki and Mrkvička 2024; Myllymäki et al. 2016). Package groupedHyperframe (v0.4.0, GPL-2) implements the following S3 methods (Table 36.20),
S3 methods of groupedHyperframe::rlabelRes (v0.4.0)
| visible | generic | isS4 | |
|---|---|---|---|
rlabelRes.ppp |
FALSE | groupedHyperframe::rlabelRes |
FALSE |
The S3 method rlabelRes.ppp() is a simple wrapper of the functions
envelope.ppp(v3.8.0, GPL (>= 2)), where the arguments supplied via the dynamic-dots...are passed;rlabel(v3.4.5, GPL (>= 2)), for which a random seed must be specified to ensure reproducibility;GET::residual(Myllymäki and Mrkvička 2024, v1.0.7, GPL–3), not to be confused with theS3generic functionresiduals(R version 4.5.3 (2026-03-11)).
The S3 method rlabelRes.ppp() returns a 'curve_set' (Chapter 17).
Listing 36.90 performs the random re-labelling envelope residual and test on the point-pattern anemones (Section 10.1).
rlabelRes.ppp(), with Kmark
set.seed(52); spatstat.data::anemones |>
  rlabelRes(fun = spatstat.explore::Kmark) |>
  GET::global_envelope_test()
# Global envelope test (1d):
#  * Based on the measure: "erl"
#  * 95% global envelope
#  * p-value of the global test: 0.01
#  * Significance level of the global test: 0.05
#  * Number of r with observed function outside the envelope: 443
#  * Total number of argument values r                      : 513
# The object contains:
# $r - Argument values                       :  num [1:513] 0 0.0879 0.1758 0.2637 0.3516 ...
# $obs - Observed function                   :  num [1:513] 0 0 0 0 0 0 0 0 0 0 ...
# $central - Central function                :  num [1:513] 0 0 0 0 0 0 0 0 0 0 ...
# $lo - Lower boundary of the global envelope:  num [1:513] 0 0 0 0 0 0 0 0 0 0 ...
# $hi - Upper boundary of the global envelope:  num [1:513] 0 0 0 0 0 0 0 0 0 0 ...
Listing 36.91 performs the random re-labelling envelope residual and test on the point-pattern anemones (Section 10.1).
rlabelRes.ppp(), with Kmark and f = `*`
set.seed(52); spatstat.data::anemones |>
  rlabelRes(fun = spatstat.explore::Kmark, f = `*`) |>
  GET::global_envelope_test()
# Global envelope test (1d):
#  * Based on the measure: "erl"
#  * 95% global envelope
#  * p-value of the global test: 0.01
#  * Significance level of the global test: 0.05
#  * Number of r with observed function outside the envelope: 443
#  * Total number of argument values r                      : 513
# The object contains:
# $r - Argument values                       :  num [1:513] 0 0.0879 0.1758 0.2637 0.3516 ...
# $obs - Observed function                   :  num [1:513] 0 0 0 0 0 0 0 0 0 0 ...
# $central - Central function                :  num [1:513] 0 0 0 0 0 0 0 0 0 0 ...
# $lo - Lower boundary of the global envelope:  num [1:513] 0 0 0 0 0 0 0 0 0 0 ...
# $hi - Upper boundary of the global envelope:  num [1:513] 0 0 0 0 0 0 0 0 0 0 ...
Listing 36.92 performs the random re-labelling envelope residual and test on the point-pattern ant (Section 10.2).
rlabelRes.ppp(), with Gcross
set.seed(12); spatstat.data::ants |>
  rlabelRes(fun = spatstat.explore::Gcross) |>
  GET::global_envelope_test()
# Global envelope test (1d):
#  * Based on the measure: "erl"
#  * 95% global envelope
#  * p-value of the global test: 0.02
#  * Significance level of the global test: 0.05
#  * Number of r with observed function outside the envelope: 95
#  * Total number of argument values r                      : 513
# The object contains:
# $r - Argument values                       :  num [1:513] 0 0.297 0.594 0.891 1.188 ...
# $obs - Observed function                   :  num [1:513] 0 0 0 0 0 0 0 0 0 0 ...
# $central - Central function                :  num [1:513] 0 0 0 0 0 0 0 0 0 0 ...
# $lo - Lower boundary of the global envelope:  num [1:513] 0 0 0 0 0 0 0 0 0 0 ...
# $hi - Upper boundary of the global envelope:  num [1:513] 0 0 0 0 0 0 0 0 0 0 ...
The random re-labelling envelope residual and test require calling the S3 generic function rlabelRes() and the function global_envelope_test() (v1.0.7, GPL-3), consecutively, e.g., Listing 36.90, Listing 36.91, Listing 36.92 for ppp-input, instead of having one single “combined” function, due to the difficulty of manipulating the formal arguments of functions envelope.ppp() (v3.8.0, GPL (>= 2)) and global_envelope_test() (v1.0.7, GPL-3). Specifically (Listing 36.93),
- the parameters
alternativeof functionenvelope.ppp()versus of functionglobal_envelope_test()have different meanings; - it’s almost impossible to determine whether some parameter(s) should be sent to the dynamic-dots
...of functionenvelope.ppp()orglobal_envelope_test().
envelope.ppp & global_envelope_test()
ag1 = spatstat.explore::envelope.ppp |>
  formalArgs()
ag2 = GET::global_envelope_test |>
  formalArgs()
intersect(ag1, ag2)
# [1] "..."         "alternative"
36.13 Batch Process on Eligible Marks
Package groupedHyperframe (v0.4.0, GPL-2) implements the following S3 methods (Table 36.21),
S3 methods groupedHyperframe::Emark_.*, groupedHyperframe::Vmark_.*, groupedHyperframe::markcorr_.*, groupedHyperframe::markvario_.*, groupedHyperframe::Gcross_.*, groupedHyperframe::Kcross_.*, groupedHyperframe::Jcross_.*, groupedHyperframe::Lcross_.*, groupedHyperframe::markconnect_.*, groupedHyperframe::nncross_.* (v0.4.0)
| visible | generic | isS4 | |
|---|---|---|---|
Emark_.ppp |
FALSE | groupedHyperframe::Emark_ |
FALSE |
Vmark_.ppp |
FALSE | groupedHyperframe::Vmark_ |
FALSE |
markcorr_.ppp |
FALSE | groupedHyperframe::markcorr_ |
FALSE |
markvario_.ppp |
FALSE | groupedHyperframe::markvario_ |
FALSE |
Gcross_.ppp |
FALSE | groupedHyperframe::Gcross_ |
FALSE |
Kcross_.ppp |
FALSE | groupedHyperframe::Kcross_ |
FALSE |
Jcross_.ppp |
FALSE | groupedHyperframe::Jcross_ |
FALSE |
Lcross_.ppp |
FALSE | groupedHyperframe::Lcross_ |
FALSE |
markconnect_.ppp |
FALSE | groupedHyperframe::markconnect_ |
FALSE |
nncross_.ppp |
FALSE | groupedHyperframe::nncross_ |
FALSE |
36.13.1 Function-Value-Table from Numeric Mark(s)
The S3 methods in Table 36.22 are user-friendly wrappers of the low-level utility function ppp_numeric2fv(). These S3 methods
- identify all eligible numeric marks in the input point-pattern;
- apply the workhorse
function from packagespatstat.explore(v3.8.0, GPL (>= 2)) per numeric mark; - return an
anylist(Chapter 15) offv.objects, named by the numeric mark(s).
| Batch Process | Workhorse function in Package spatstat.explore |
|---|---|
Emark_.ppp(), Vmark_.ppp(), e.g., Listing 36.95, Listing 36.96, Listing 36.94 |
Emark and Vmark, conditional mean \(E(r)\) and variance \(V(r)\), diagnostics for dependence between the points and the marks (Schlather et al. 2003) |
markcorr_.ppp() |
markcorr, marked correlation \(k_{mm}(r)\) or generalized mark correlation \(k_f(r)\) (Stoyan and Stoyan 1994) |
markvario_.ppp() |
markvario, mark variogram \(\gamma(r)\) (Wälder and Stoyan 1996) |
Kmark_.ppp() |
Kmark, mark-weighted \(K_f(r)\) function (Penttinen et al. 1992) |
Listing 36.94 showcases the exception handling of the point-pattern ants (Section 10.2) without any numeric mark.
Emark_.ppp(), no numeric mark
spatstat.data::ants |>
  Emark_() |>
  is.null() |> stopifnot()
Listing 36.95 finds the conditional mean \(E(r)\) of the eligible numeric mark area in the point-pattern betacells (Section 10.4).
Emark_.ppp()
spatstat.data::betacells |>
  Emark_(unlist1 = FALSE) |>
  as.fvlist()
# An 'fvlist' of 1 fv.objects E(r)
# Name(s): area
# Available rmax: 187.5
# Minimum Legal rmax: 187.5
Listing 36.96 shows that a generic name m is used for the 'vector' mark-format of the point-pattern spruces (Section 10.21).
Emark_.ppp(), 'vector' mark-format
spatstat.data::spruces |>
  Emark_(unlist1 = FALSE) |>
  as.fvlist()
# An 'fvlist' of 1 fv.objects E(r)
# Name(s): m
# Available rmax: 9.5
# Minimum Legal rmax: 9.5
A similar mechanism exists in package spatstat.explore (v3.8.0, GPL (>= 2)) for ppp.object with 'dataframe' mark-format. Table 36.23 shows the difference and connection between the batch mechanism in Table 36.22 versus that in package spatstat.explore. Listing 36.97 illustrate them using a point-pattern finpines (Section 10.11) with two numeric marks.
'dataframe' mark-format
In Package spatstat.explore (v3.8.0, GPL (>= 2)) |
In Table 36.22 | |
|---|---|---|
Input ppp.object |
Require all marks be numeric | Select the eligible numeric marks |
| Output | An fv.object for one numeric mark, or an anylist-of-fv.objects with 2+ numeric marks |
An fv.object for one eligible numeric mark, or an anylist-of-fv.objects with 2+ eligible numeric marks |
markcorr_.ppp() versus markcorr()
stopifnot(identical(
  x = spatstat.data::finpines |> markcorr_(),
  y = spatstat.data::finpines |> spatstat.explore::markcorr()
))
36.13.2 Function-Value-Table from Multi-Type Mark(s)
The S3 methods in Table 36.24 are user-friendly wrappers of the low-level utility function ppp_multitype2fv(). These S3 methods
- identify all eligible multi-type marks in the input point-pattern;
- apply the workhorse
function from packagespatstat.explore(v3.8.0, GPL (>= 2)) per multi-type mark; - return an
anylist(Chapter 15) offv.objects, named by the multi-type mark(s).
fvlists
| Batch Process | Workhorse function in Package spatstat.explore |
|---|---|
Gcross_.ppp(), e.g., Listing 36.98 |
Gcross, multi-type nearest-neighbor distance \(G_{ij}(r)\) |
Kcross_.ppp() |
Kcross, multi-type \(K_{ij}(r)\) |
Jcross_.ppp() |
Jcross, multi-type \(J_{ij}(r)\) (Van Lieshout and Baddeley 1999) |
Lcross_.ppp() |
Lcross, multi-type \(L_{ij}(r)=\sqrt{\frac{K_{ij}(r)}{\pi}}\) |
markconnect_.ppp() |
markconnect, multi-type \(p_{ij}(r)\) |
Listing 36.98 finds the multi-type nearest-neighbor distance \(G_{ij}(r)\) from the marks 'off' to 'on' in the eligible multi-type mark type in the point-pattern betacells (Section 10.4).
Gcross_.ppp(., i = 'off', j = 'on')
spatstat.data::betacells |>
  Gcross_(i = 'off', j = 'on', unlist1 = FALSE) |>
  as.fvlist()
# An 'fvlist' of 1 fv.objects G[off,on](r)
# Name(s): type
# Available rmax: 204.686521588743
# Minimum Legal rmax: 204.7
36.13.3 Distance from Multi-Type Mark(s)
The S3 methods in Table 36.25 are user-friendly wrappers of the low-level utility function ppp2dist(). These S3 methods
- identify all eligible multi-type marks in the input point-pattern;
- apply the workhorse
function per multi-type mark; - return an
anylist(Chapter 15) ofnumericvectors, named by the multi-type mark(s).
vectors
| Batch Process | Workhorse function |
|---|---|
nncross_.ppp(), e.g., Listing 36.99 - Listing 36.104 |
.nncross() (Section 36.6), nearest neighbor distance |
Listing 36.99 applies the function .nncross() (Section 36.6) to the multi-type mark type in the point-pattern betacells (Section 10.4), which contains (at least) the two levels of 'off' and 'on'.
nncross_.ppp(., i = 'off', j = 'on')
spatstat.data::betacells |>
  nncross_(i = 'off', j = 'on', unlist1 = FALSE) |>
  as.vectorlist()
# A 'vectorlist' of 1 vectors
# Name(s): type
# Storage Mode: numeric
# Individual Vector Length: 70
Listing 36.100 applies the function .nncross() (Section 36.6) to the multi-type mark group in the point-pattern gorillas (Section 10.13), which contains (at least) the two levels of 'major' and 'minor'.
nncross_.ppp(., i = 'major', j = 'minor')
spatstat.data::gorillas |>
  nncross_(i = 'major', j = 'minor', unlist1 = FALSE) |>
  as.vectorlist()
# A 'vectorlist' of 1 vectors
# Name(s): group
# Storage Mode: numeric
# Individual Vector Length: 350
Listing 36.101 applies the function .nncross() (Section 36.6) to the multi-type mark season in the point-pattern gorillas (Section 10.13), which contains (at least) the two levels of 'rainy' and 'dry'.
nncross_.ppp(., i = 'rainy', j = 'dry')
spatstat.data::gorillas |>
  nncross_(i = 'rainy', j = 'dry', unlist1 = FALSE) |>
  as.vectorlist()
# A 'vectorlist' of 1 vectors
# Name(s): season
# Storage Mode: numeric
# Individual Vector Length: 372
Listing 36.102 showcases the exception handling when no eligible multi-type mark exists in the point-pattern gorillas (Section 10.13) that contains both levels 'alpha' and 'beta'.
nncross_.ppp(., i = 'male', j = 'female')
spatstat.data::gorillas |>
  nncross_(i = 'male', j = 'female') |>
  is.null() |> stopifnot()
Listing 36.103 uses a generic name m for the 'vector' mark-format of the point-pattern ants (Section 10.2).
nncross_.ppp(), 'vector' mark-format
spatstat.data::ants |>
  nncross_(i = 'Cataglyphis', j = 'Messor', unlist1 = FALSE) |>
  as.vectorlist()
# A 'vectorlist' of 1 vectors
# Name(s): m
# Storage Mode: numeric
# Individual Vector Length: 29
Listing 36.104 showcases the exception handling with the point-pattern spruces (Section 10.21), which does not contain a multi-type mark.
nncross_.ppp(), no multi-type mark
spatstat.data::spruces |>
  nncross_() |>
  is.null() |> stopifnot()